Editing
In this section we will have a closer look at various editing functions, for example how to
move, scale and color objects.
Create an object
How to create a base object is described in the Base object section above. Normally you
create and object by clicking on the symbol in the tool panel, and then click or drag with
the left mouse button in the work area. Subgraphs are created by selecting a subgraph in the
subgraph palette and click with MB2 in the work area.
Select an object
You select an object with Click MB1. A selected object is marked with red color. If you want
to select several object click on them with Shift/Click MB1.
To select objects in the certain area you can also drag with MB1 in the work area The
objects inside the selection rectangle will be selected. As objects are also moved by
drag MB1 you should avoid to hit an object when starting the drag. If this is hard to
avoid you can use Shift/Drag MB1 that adds objects to the select list.
Note that when you change the color of a selected object the red marking is removed, as
you then want to se the new color instead. The object is though still selected.
By right clicking in the work area the select list is emptied.
Delete an object
To delete an object you select the object and press the Delete key. You can also delete an
object by double clicking with MB2 on the object. With doubleclick MB2 in some empty space in
the work area you delete all selected objects.
Move an object
An object is moved with drag MB1. If several object should be moved concurrently, you
select them and drag one of the objects. All selected object will then follow. If the
movement should be vertical or horizontal, you can use Functions/MoveRestrictions/Vertical
(Ctrl+G) or Functions/MoveRestrictions/Horizontal (Ctrl+H). These functions are active
until you reset with right click.
If Snap to grid is activated in the tool panel, the position of an object is adjusted to
nearest grid point when the object is moved.
You can also move an object with the move command. This will give a more precise movement
than if you move with the mouse. You can move by supplying relative or absolute coordinates.
The command to move the selected object to the point (1,1) is
ge> move selected /absx=1 /absy=1
Object with fix position
Large objects in the background are easy to move by mistake when you edit. For some objects
as rectangles, ellipses and polylines you can set the attribute 'fixposition' that locks
the object at a certain position.
Copy an object
You copy objects by selecting them and activating Edit/Copy (Ctrl+C) and Edit/Paste (Ctrl+V)
in the menu. After paste the objects are following the cursor, and by clicking with MB1 you
position them in the work area. When pasting you can select vertical (Ctrl+G) or
horizontal (Ctrl+H) movement.
Scale an object
An object is scaled by selecting the object, activating Scale in the tool panel, and then
stretch the rectangle that surrounds the objects. Terminate with click MB3. If you want
the proportions between width and hight to be preserved, press first Ctrl+E (Scale Equal).
There is also a button in the tool panel to double the size of an object, and one button
to half the size.
Rotate an object
An object can be rotated with the rotation button in the tool panel. Selected objects will
be rotated in steps of 90 degrees.
I you want another rotation angle you activate Edit/Rotate in in the menu. Note that
rectangles and ellipses only can be rotated in steps of 90 degrees, and to rotate texts
the Adjustment attribute for the text has to be set to Center.
Mirror
There are two buttons in the tool panel to mirror, one for horizontal mirroring an one for
vertical mirroring. The mirroring it executed on the selected objects.
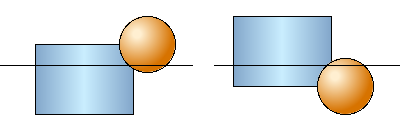
Fig Horizontal mirroring
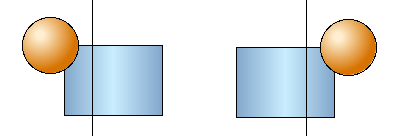
Fig Vertical mirroring
Change object color
There are three different types of colors that can be selected in the color palette, fill
color, border color and text color. In the palette you find the buttons Fill, Border and
Text where you mark which color type should be selected. When you then select a color in
the palette the color of the selected objects are changed. The selected color combination
is also applied to new objects that are created.
Fill color
To set the fill color of an object, you select the object, check that Fill is active in the
color palette, or else you click on Fill. Then you select the color you want to set on the
object. In the example below the fill color is changed from blue to green.
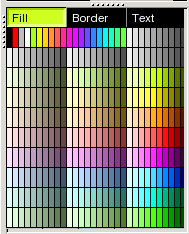
Fig Fill is marked and a green tone is selected.
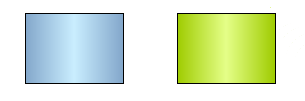
Fig Fill color is change from blue to green
Border color
The border color is changed in a similar way. Now you mark Border in the color palette, and
then select the border color that should be set to the selected objects.
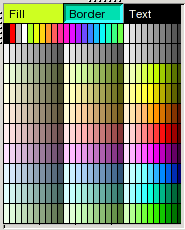
Fig Border is marked and a bluegreen tone is selected for border color
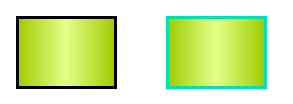
Fig Border color changed from black to bluegreen
Text color
To change the text color, you activate Text in the color palette, and then choose the text
color that should be set to the selected objects.
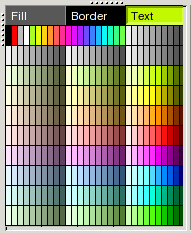
Fig Text is marked and a green tone is selected
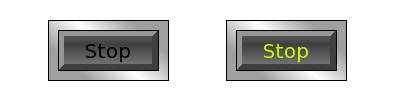
Fig The text color is changed from black to green
Background color
You set the background color the the graph by selecting a fill color in the color palette
and activate Functions/Set Background Color in the menu.
Grid
The two buttons Show grid and Snap to grid, together with the Gridsize menu handles the
grid function. Show grid shows all grid points, and with the Gridsize menu you can set the
distance between the grid points. When Snap to grid is activated, the coordinates for objects
that are created or moved will be adjusted to nearest grid point.
The gridsize can be set to 1.0, 0.5, 0.25 or 0.10 in the Gridsize menu. With the
'set gridsize' command it is also possible to set other values on the grid size. To set the
grid size to 0.20 enter the command
ge> set gridsize 0.20
Order objects
There are a number of buttons in the tool panel to adjust the position of number of objects
to place them on the same horizontal or vertical level.
You can also adjust the position so objects will be placed on equal distance from each other.
Groups
You create a group of a number of objects by selecting the objects and pressing the Group
button in the tool panel. The group is then handled as if it where an individual object,
for example when you select, move or scale it. If you want to make a change in a member
object, the group has to be dissolved by the Ungroup button, then you can make the change
and group again.
Groups have the properties dynamic and action, ie you can connect them to signals in the
database and for example change color of the group dependent on the status of a signal.
You can also make them sensitive for click, and set signal values when they are clicked on.
These are properties they share with subgraphs, that the base objects lacks. If you want to
set dynamic on a base object, eg a rectangle, you have to create a group with only the
rectangle, and then you will get the possibility to set dynamic and action on the rectangle.
In this way you can create an indicator, pushbutton or a bar from the rectangle.
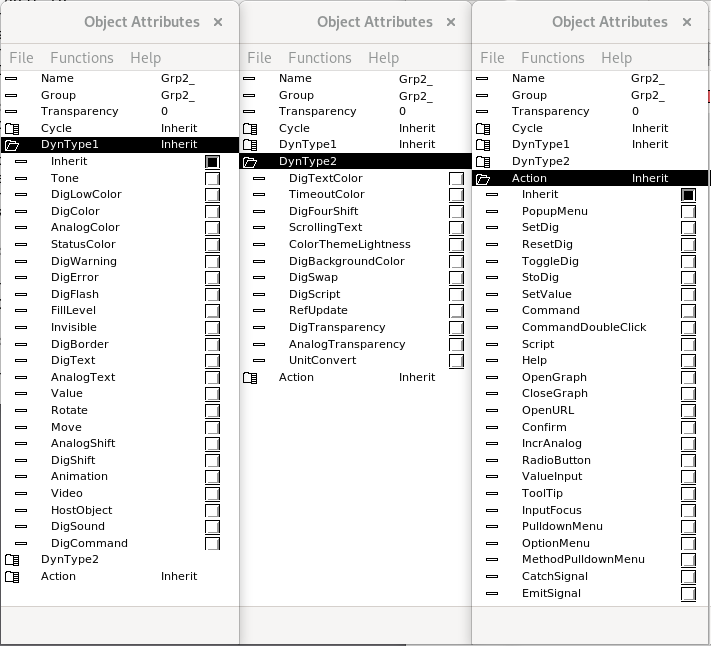
Fig The object editor for a group with attributes for dynamic and action