Bar
A bar displays the value of an analog signal. The bar is found under the Analog map in the
subgraph palette.
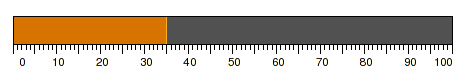
Fig Bar
The bar is configured by connecting it to an analog signal, and insert the range for the
bar in Bar.MinValuie and Bar.MaxValue. The axis object in the figure is not a part of the
bar object.
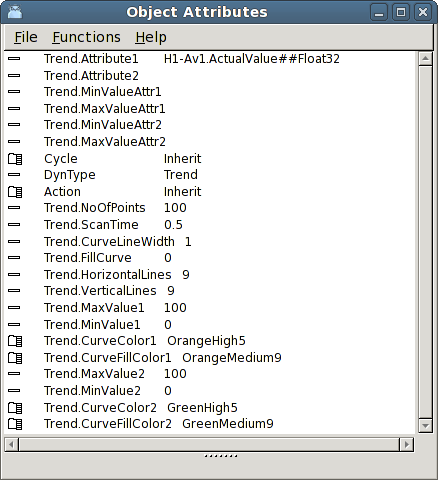
Fig Bar object attributes
If the bar is a part of an object graph, the range can differ between different instances
of the database object that the graph shows. It is then possible to connect
Bar.MinValueAttr and Bar.MaxValueAttr to the attributes in the database that contains the
min and max value for the range of the signal.
Note that a bar also can be accomplished by a rectangle that is grouped and provided with
FillLevel dynamics. The difference is that the bar object has a border line with separate
color between the bar and the background.