Table
Table is a lucid disposition of data, organized in rows and columns, often provided with
headers. Table is found under the Other map in the subgraph palette.
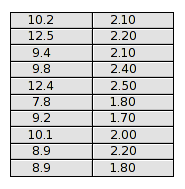
Fig Table without header
The data for one column is usually gathered in an array attribute in the database. There
are a number of classes with arrays of different type, eg AArray100 and AArray500 the
contains arrays with 100 and 500 elements respectively of type Float32. Corresponding
objects also exist for boolean, integer and strings, DArray, IArray and SArray. In the
example below data is gathered in 3 AArray100 objects and one SArray100.
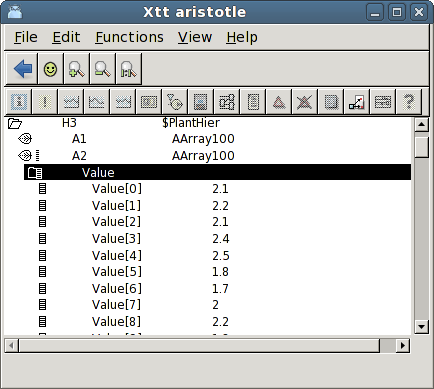
Fig Array objects contains table data
If we look at the simple table in Fig Table without header above, two columns are displayed.
The number of columns are stated in Table.Columns. Column1.Attribute and Column2.Attribute
are connected to two array attributes containing that data that is to be displayed in the
columns, H3-A1.Value and H3-A2.Value. The syntax is H1-A1.Value##Float32#100 which means
that the attribute is an array of type Float32 with 100 elements. You also has to specify
the output format for the values in the columns, by inserting Column1.Format and
Column2.Format. '%6.1f' means a float value with 6 characters and 1 decimal.
Some other details are modified in table object,
- The font is set to Lucida Sans, by selecting the table, and set Lucida Sans in the tool bar.
- The text size is increased to 12 from Textsize in the tool panel.
- The row height is adapted to the larger text size by setting Table.RowHeight to 0.8.
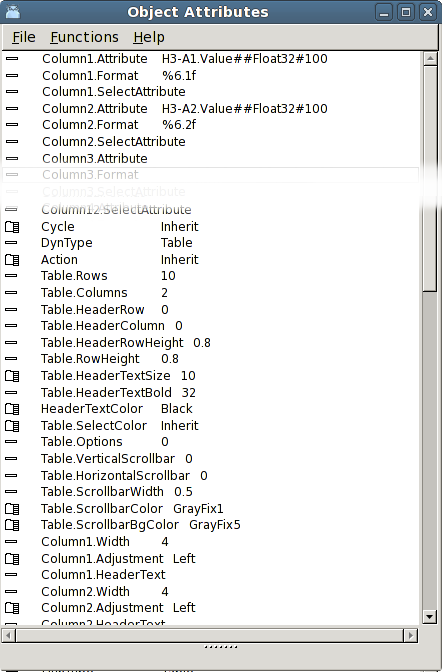
Fig Table object attributes
The figure below shows a table with a header. Here the Table.HeaderRow is set to 1. The text
size for the header, Table.HederTextSize set set to 12 and Table.HeaderTextBold is set to 0
for normal text.
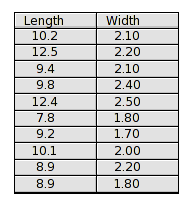
Fig Table with header
In the table below a vertical scrollbar is added by setting Table.VerticalScrollbar to 1.
Note that the header row is not scrolled but always visible.
The table object displays 3 columns, the first is connected to a string array of type
SArray100.Value, and the format Column1.Format is set to %s. The first column is also marked
as a header column, by setting Table.HeaderColumn to 1. It implies that the border line
between the first and second column is a little thicker. It also affects the horizontal
scrolling which we will see in the next example.
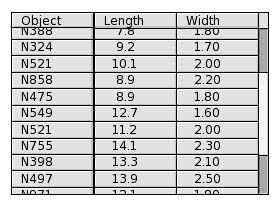
Fig Table with vertical scrollbar and header column
The figure below shows how a header column works with a horizontal scrollbar. The horizontal
scrollbar is viewed when Table.HorizontalScrollbar is set to 1. Note that the scrollbar
does not cover the first column. The first column is always visible.
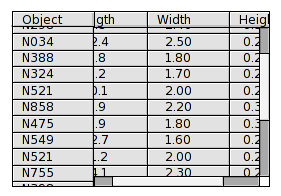
Fig Table with horizontal scrollbar and header column
Table displaying objects of the same type
Now we will look at an example where the data is not organized in arrays, but in a number
of objects of the same class. Under H3-Data in the plant hierarchy there is a number of
objects of class Thing. Thing has the attributes Length, Height and Width. We want to show
the content of all the Thing objects in a table, with one object on each row. To do this
we have to create an array of type Objid that contains the identity of each object that is
to be displayed. Thus we create an object of type OidArray and insert the identities of all
Thing objects.
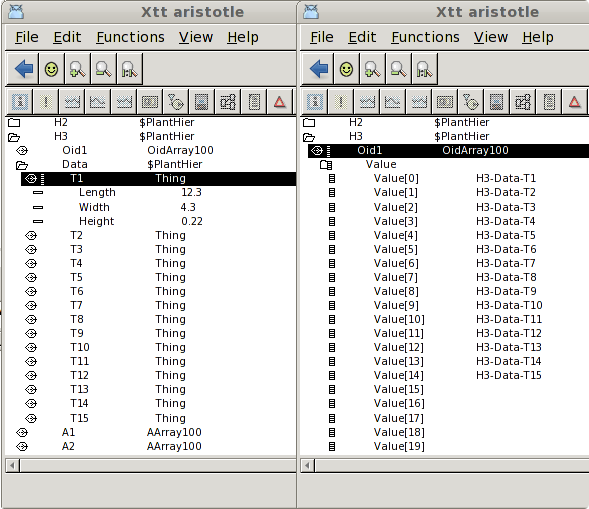
Fig The objects that will be displayed to the left, an array of the objid to the right
We create a table with four columns. The first column will show the name of the object, The
second the Length attribute, the third Width and the fourth Height. The table is configured
by connecting the array with the object identities to Column1.Attribute. In Column2.Attribute
'$header.Length##Float32' is stated. $header points at the object displayed in the same row
in the header column, and the Lengh attribute of this object will be displayed in this column.
In the same way we state '$header.Width##Float32' in Column3.Attribute and
'$header.Height##Float32' in Column4.Attribute.
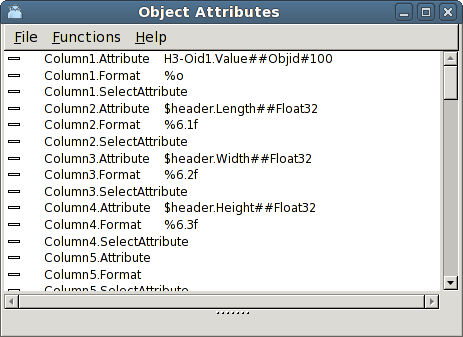
Fig The attributes of the table columns
The result is shown in the figure below. In the first column the name of the objects is
displayed, and in the same row the content of the object.
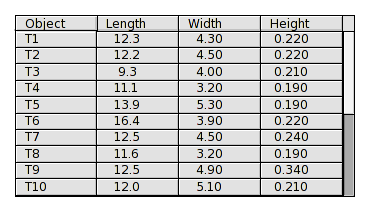
Fig Table showing the object name and the content of the objects
Table with selection function
Sometimes you want to be able to select a cell in a table, and execute something in the plc
program with the selected data or object. You do this by connecting a boolean array to the
attribute SelectAttribute for a column. In the example below the array H3-Select1.Value is
connected to Column1.SelectAttribute.
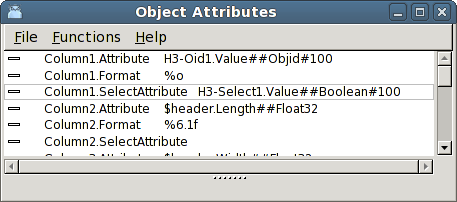
Fig A selection array is supplied for the first column
The first column will now be click sensitive, and the selected cell will be marked with a
distinctive color stated in Table.SelectColor.
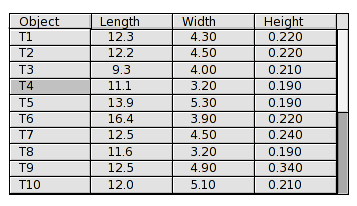
Fig The fourth row in the first column is selected
The element in the array that corresponds to the selected object will be set to 1. In the
figure above, the forth row is selected, which implies that the fourth element in the select
array will be set, ie H3-Select1.Value[3].
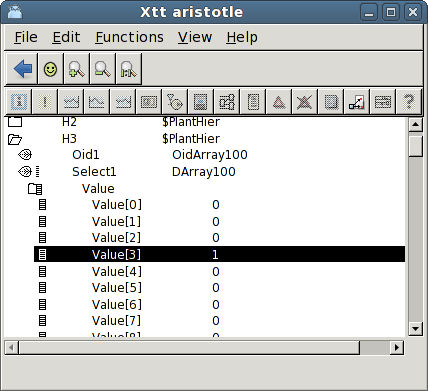
Fig The corresponding array element of the selected row is set