Trend
A trend displays a curve of the value of one or two signals. The signals can be analog,
digital or integer. Trend is found under the Analog map in the subgraph palette.
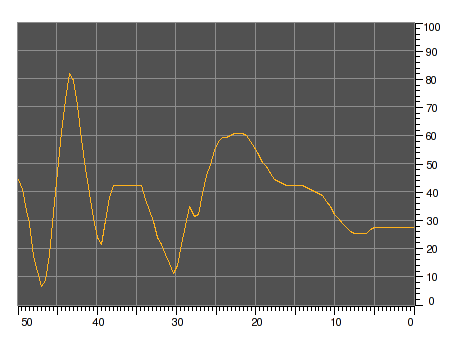
Fig Trend curve
The trend object above is configured with an analog signal. The number of vertical and
horizontal lines has been increased by setting Trend.HorizontalLines and Trend.VerticalLines
to 9. The axes are not included in the trend object, but has to be created with axis objects.
The vertical axis has the range 0-100 as Trend.MinValue1 is 0 and Trend.MaxValue1 is 100.
The time axis range is 50 s as Trend.ScanTime is 0.5 and the number of stored points,
Trend.NoOfPoints is 100.
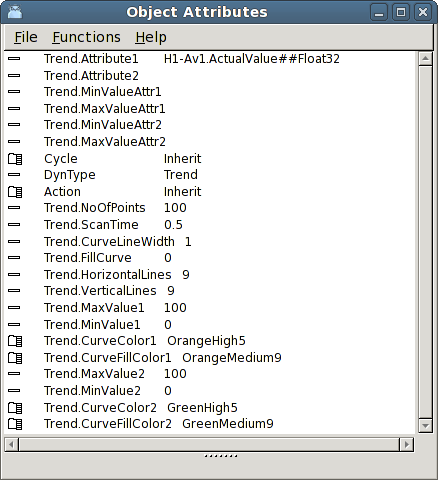
Fig Attributes for a trend object
If the trend is a part of an object graph, the range can differ between different instances
of the database object that the graph shows. It is then possible to connect
Trend.MinValueAttr and Trend.MaxValueAttr to the attributes in the database that contains the
min and max value for the range of the signal.