Window
The window object is a frame that displays a graph in a specified area in another graph.
The graph is displayed with or without scrollbars. If is also possible to shift the graph
displayed in the window by executing a command from a push button. You can also display
object graphs for various objects in the database.
Here are some fields of application for the window object
- you have a table like part of the graph the takes to much space. This can be put in
a window object and by utilizing the scrollbar of the window object you will gain space.
- you want to show information about a database object that already has an object graph.
- it is possible to build a graph with a window object that displays different graph
dependent on a set of pushbuttons or menu alternatives. See also TabbedWindow.
Display a graph in a window object
The window object is found under the Other map in the subgraph palette. Create the object by
middle click in the work area and scale the object to desired size.

Fig Window object
Open the object editor and supply the name of the graph that is to be displayed in
Window.Filename. Note that the graph is read from $pwrp_exe, and as graphs in window objects
often doesn't have an XttGraph object, they will not be copied automatically from $pwrp_pop
to $pwrp_exe. The copying then has to be done by hand or by a make file.
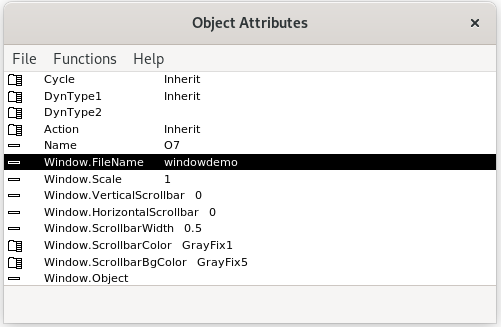
Fig The object editor for a window object with supplied filename
When the filename is inserted and the file exist on $pwrp_exe the graph will be displayed
in the window object.
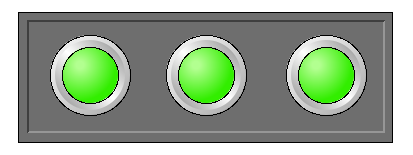
Fig Window object with inserted filename
Display an object graph in a window object
Several database objects have an object graph that is opened from 'Object Graph' in the
popup menu for the object. Also object graphs can be viewed in window objects by
specifying the name of the graph file. Also the database object that the graph should be
connected to has to be specified in Window.Object.
If the object class is a part of the ProviewR release, the filename for the object graph is
$pwr_exe/pwr_c_'classname'.pwg. For an Av object this will be $pwr_exe/pwr_c_av.pwg. You
have to specify the path in the filename as the file is located in the default directory
$pwrp_exe.
If the class reside in a class volume in the project, the filename is
$pwrp_exe/'classname'.pwg. In this case there is no need to specify the path.
In the example below the object graph for the Av object H1-Av1 is displayed. The graph is
scaled to 3/4 of the original size by setting Window.Scale to 0.75.
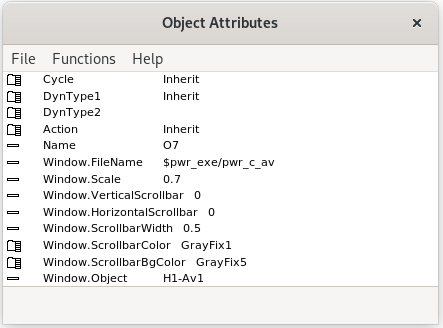
Fig Attributes for a window object displaying an object graph
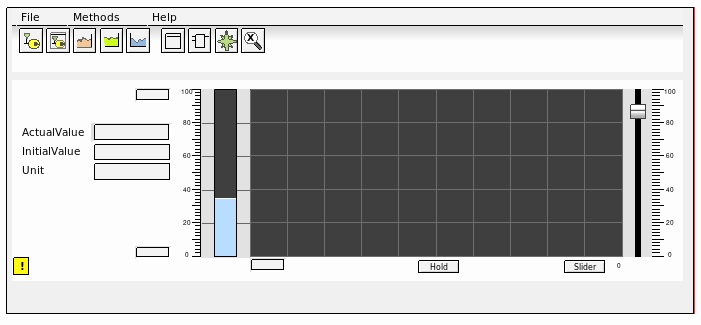
Fig Object graph for an Av displayed in the window object
Shift between two different graphs
There is an xtt command that displays a specific graph in a window object. By setting this
command in a number of pushbuttons you can shift between different graphs in one window
object. The function is similar to a TabbedWindow. The difference is that you have a more
free layout of the push buttons, and that there is no limitation in the number of graphs
that can be displayed.
The command is
set subwindow 'graphname' /name= /source= [/object=]
where grapname is the name of the graph that contains the window object. In /name the name
of the window object is specified, and in /source the filename of the graph that is to be
displayed. /object is used when an object graph is displayed, and specifies the database
object the graph should be connected to.
In the following example, the object graphs for a number of Dv are displayed in a window
object. You can insert a start graph in Window.FileName, but you can also let the window
object be empty until one of the buttons are activated. In this case you should insert
"_no_" in Window.FileName to avoid and error output.
The graph containing the window object is saved with the name 'dvdisplay'. It also contains
6 pushbuttons of type CommandButtonCenter. The window object is named 'DvWindow' by
activating Edit/Change Name in the menu. In the figure below the object editor for a
pushbutton is viewed with the command inserted. Note that the filename has to be surrounded
by quotation marks as it contains a slash.
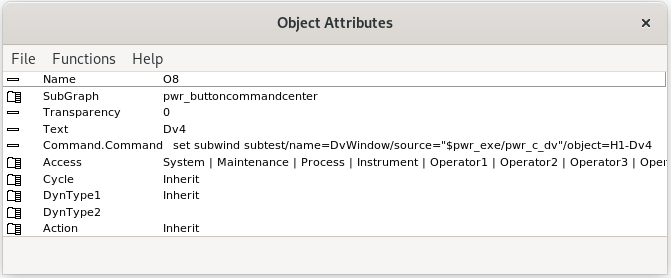
Fig Command 'set subwind' in a pushbutton
The final graph will look like this with Dv4 selected.
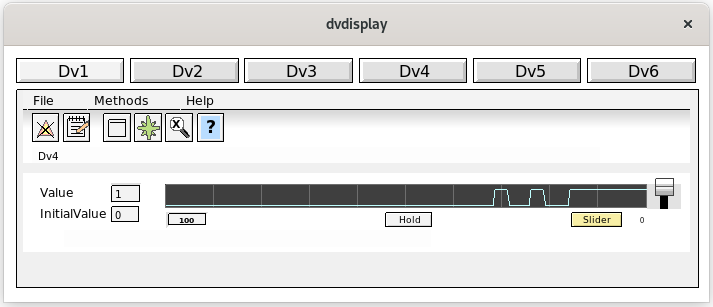
Fig The object graph for Dv4 is displayed after a click on the Dv4 button