XYCurve
The XYCurve plots a curve specified with two arrays containing the x and y values for points
in the curve. There is a special XYCurve class that is convenient to use, with all the
necessary attributes and two arrays with 100 elements.
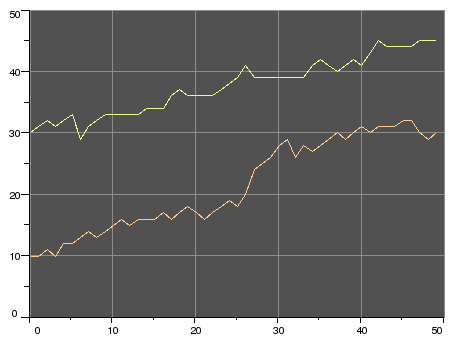
Fig XYCurve
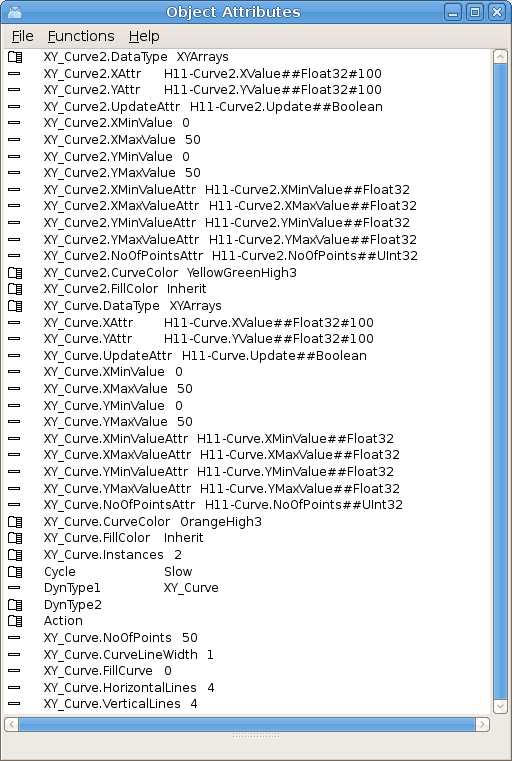
Fig Attributes for an XYCurve object