Subgraphs
A subgraph is a graphic component built by base objects. It often symbolizes a certain
element in the plant, eg a valve or a pump, but it can also be a pushbutton or an input
field.
Create a subgraph
To the right in the editor, the subgraph palette is found, and you create a subgraph by
selecting a subgraph in the palette and click with MB2 in the work area. In the figure
below a Valve under the Process map is selected.
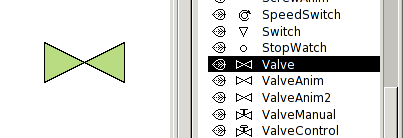
Fig A valve subgraph
On most subgraphs you can apply 3D and different kinds of gradients. There are though some
subgraphs that are not adapter for this.

Fig Valve with 3D to the left, and 3D + gradient to the right
Change color
The valve in the figure is a monochrome subgraph, and you can change the color by selecting
a fill color in the color palette in the same way as for base objects. You can also modify
the border color and border width.

Fig Blue colored valve
Polychrome subgraphs
On subgraphs that contain different color, you change the color with the functions for color
shift or with the color tone palette. Let us create a burner (Process/Burner) that contains
the colors yellow and orange.

Fig Polychrome subgraph
If we set a fill color we will lose the color drawing and the burner will be monochrome.
Instead we use the buttons for color shift in the tool panel (the right buttons in the
figure below). Select the subgraph and click on the arrows to shift the color.
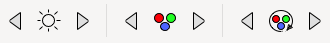
Fig Buttons to shift color
Now the colors are rotated on the color wheel so that the subgraphs is still drawn with two
colors, and the color contrast is kept. You can also use the buttons for changing intensity
and lightness, positioned the right of the color shift buttons, to adjust the subgraph color.
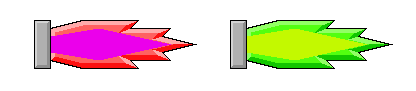
Fig Example of burners with shifted colors
Another way of changing the color of a polychrome subgraph is to use the color tone palette
(the lower part of the color palette in the figure below). Select the subgraph and click on a
color tone in the palette.
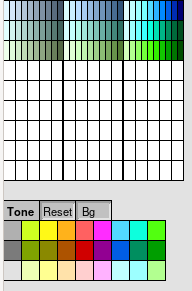
Fig Färgtons-paletten
The result is that the different parts have the same color tone, but the lightness contrast
between the different parts is kept.

Fig Burners with various color tones applied
Connection points
Some subgraphs contains connection points that makes it possible to draw connections between
the subgraphs. You create a connection by dragging MB2 from a connection point in a subgraph,
and release MB2 at a connection point in another subgraph. For the connections, line width,
color and 3D can be set. If you release a connection in the work area, a junction is created,
from which connections in different directions can be drawn.
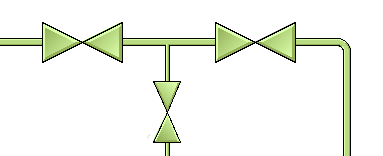
Fig Subgraphs with connections
Dynamic and action
Subgraphs have, like groups, the properties dynamic and action, which makes is possible
to connect them to signals in the database and change color and shape dependent on the
status of a signal. It is also possible to make them sensitive for mouse clicks and set
signals when they are clicked on. Furthermore, subgraphs have often a preprogrammed
dynamic or action. An indicator has for example the dynamic to change color as default, so
you only have to connect it to a signal to make it work.
Let us create an indicator and look at how to change the color. We mark an indicator
Indicator/IndRoundMetalFrame in the subgraph palette and click with MB2 in the work area to
create the indicator. To connect it to a signal in the database we click on the navigator
button in the tool panel. Now the plant hierarchy is displayed to the left. We want the
indicator to show status of the Dv H1-Dv3, and find the Dv in the plant hierarchy. By
selecting H1-Dv3 and click with Ctrl+Doubleclick MB1 on the indicator the connection is made.
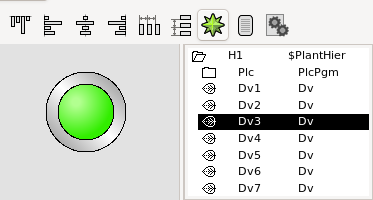
Fig A signal is connected to the indicator with Ctrl+Dubbleclick MB1
By opening the object editor for the indicator we can check that the connections is done.
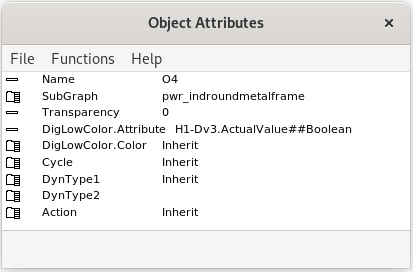
Fig The indicator object editor
We can see that the indicator has the default dynamic DigLowColor, that shifts between
two colors, and DigLowColor.Attribute is set to H1-Dv3.ActualValue.
When we open the graph in rt_xtt we can se how the indicator shifts between green and
dark gray when Dv3 shifts between 1 and 0.

Fig The indicator when the Dv is 1 to the left and 0 to the right
If we take a look at the valve above, it has a slightly more advanced dynamic. It can shift
between three different colors, and thus has to be connected to two signals. One signal
colors the valve red to indicate a fault, and the other colors the valve white to indicate
closed valve.
If we open the object editor for the valve we can see that DigError.Attribute should be
connected to a signal indicating fault, and DigLowColor.Attribute to a signal indicating
that the valve is open.
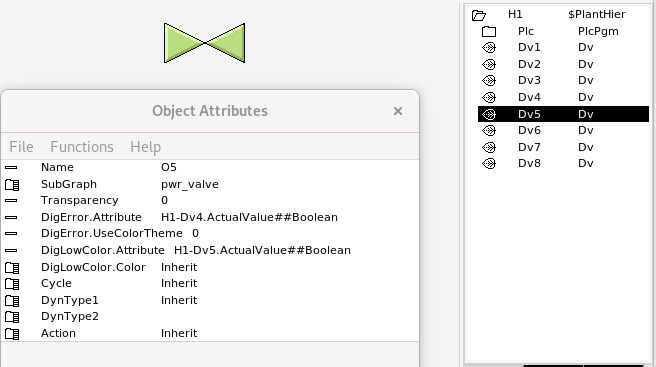
Fig Valve connected to two signals
In this case we will make the connection in the object editor, and select H1-Dv4 in the
plant hierarchy. By clicking with Ctrl+Doubleclick MB1 on the attribute DigError.Attribute,
H1-Dv4 in inserted. In the same way, H1-Dv5 is inserted into DigLowColor.Attribute. We
can see the result in the figure below. When Dv4 is 0, ie the valve is closed, it is colored
white. When Dv4 is high, ie the valve is opened, it is colored green. If we set the fault
signal Dv4 it is colored red independent of the value of Dv5. This is due to the fact that
DigError has higher priority than DigLowColor. In the object editor, the dynamics are
ordered by priority, with the highest priority on top and the lowest priority at the
bottom.
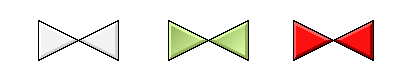
Fig Closed valve to the left, open valve in the middle and fault signal to the right
If we want to mark closed valve with dark gray instead of white, we change the color in
DigLowColor.LowColor. The default value is Inherit, ie a white preprogrammed color will be
chosen. By choosing GrayHigh9 instead, the color when the signal is low will be dark gray.
If you have difficulties with identifying the colors, you can select desired color as fill
color in the color palette, and click with Ctrl+Doublelclick MB1 on DigLowColor.LowColor to
insert the color.
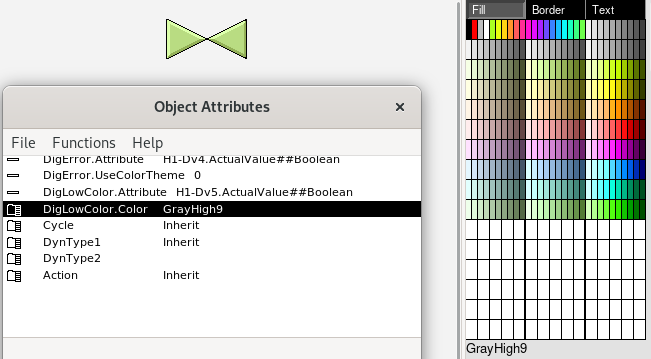
Fig LowColor is changed from Inherit to dark gray
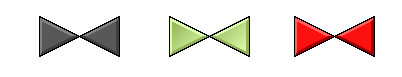
Fig Closed valve to the left, open valve in the middle and fault signal to the right