| Attribute | Description | |
| BarChart.Attribute0 | The name of an array in the database. The array values states the size | |
| of the first segment in the different bars. | ||
| BarChart.Attribute1 | Array for the second segment. |
| BarChart.Attribute11 | Array for the twelveth segment. | |
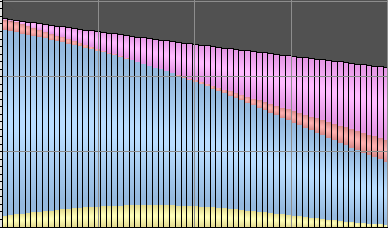
| BarChart.Bars | Number of bars. | |
| BarChart.BarSegments | Number of segments in each bar. | |
| BarChart.MaxValue | Value that corresponds to full length of a bar. | |
| BarChart.MinValue | Signal value that corresponds to zero length of a bar. | |
| BarChart.BarColor1 | Fillcolor for the first segments. | |
| BarChart.BarColor2 | Fillcolor for the second segments. |
| BarChart.BarColor12 | Fillcolor for the twelveth segments. | |
| Dynamic | Not implemented |