Dashboard
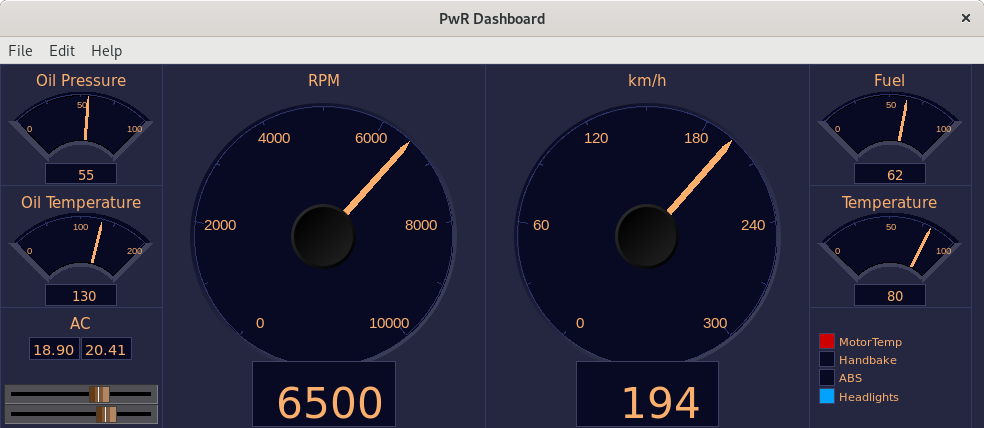
The dashboard is a simplified graph with a very limited number of building blocks. The
building blocks are called dashcells that can display values in the shape of indicators,
value fields, bars, trends, gauges etc.
The dashboard can be created in the Ge editor, or in the operator environment. The building
blocks and how to create a dashbord in the operator environment is described in Operator's
Guide.
In the Ge editor, a dashbord is created in the following way.
- Open Graph Attributes and set Dashboard to 1.
- Open Graph Attributes again and set the size of the dashboard in DashRows and DashColumns.
- Dash cells are drawn with colortheme colors, thus select a colortheme from
File/Colortheme/Select in the menu.
- Set the background color to the first color in the custom color palette.
- If the dashboard should follow the color theme selected by the operator, set ColorTheme
in Graph Attributes to $default.
- Create a DashCell from Other/DashCell in the subgraph palette.
- Double click on the cell to set properties and size, and connect the cell to a signal.
- Save and build the dashboard.
The dashboard is saved in a pwd file on $pwrp_pop, that is copied to $pwrp_exe when it's
built. This file should be distributed to the operator station.
The dashboard can be opened from Functions/Dashboard/Open i the Xtt menu, or with the
command 'open dashboard'.