Pie


Pie is a circular chart with a number of sectors in different color. The maximum number of
sectors is 12. The size of each sector corresponds a to a signal value.

The properties fill, fillcolor, bordercolor etc. states properties for the background circle.
The properties for the sectors are stated in the object editor.
A Pie is created by selecting Pie in the subgraph palette, 'Analog/Pie', and clicking
MB2 in the working area.

Properties

- Fill (for the background circle)
- Fillcolor (for the background circle)
- Border (for the background circle)
- Bordercolor (for the background circle)
- Linewidth (for the background circle)

Attributes

Attribute                          Description
Pie.Attribute0                          Database attribute of type Float that influences the size of
                         the first sector.
Pie.Attribute1                          Database attribute for the second sector.
...
Pie.Attribute11                         Database attribute for the twelfth sector.
Pie.Angle1                         Angle from the x-axis in degrees to the start of the chart.
Pie.Angle2                         Angle in degrees that states the size of the chart.
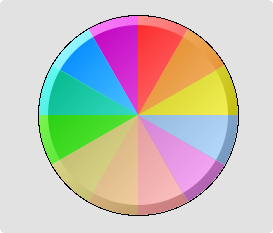
Pie.Sectors                         Number of sectors.
Pie.MaxValue                         Maximum value for the diagram range.
Pie.MinValue                         Minimum value for the diagram range.
Pie.SectorColor1                        Fillcolor for the first sector.
Pie.SectorColor2                        Fillcolor for the second sector.
...
Pie.SectorColor12                       Fillcolor for the twelveth sector.
Dynamic                         Not implemented