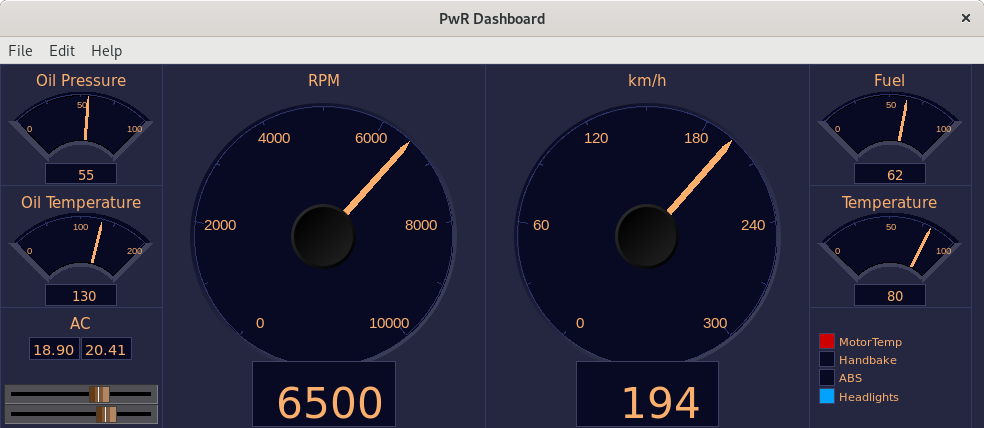
Dashboard
The dashboard is a simplified graph with a very limited number of building blocks. The
building blocks are called dashcells that can display values in the shape of indicators,
value fields, bars, trends, gauges etc.
The dashboard can be created in the Ge editor, or in the operator environment.
The dashboard is divided in rows and columns where the cells are positioned. A cell
initially has the height of one row and the width of one column, but can be expanded over
several rows and columns.
The cell can contain several elements. A bar cell for example, can contain three elements.
Each element is connected to an analog attribute that are displayed with a bar. A trend cell
can contain two elements and show two curves.
There are three major cell types, analog, digital and object.
Analog dashboard cells
Bar
A bar cell displays an analog value with a bar and a value. I can contain three elements.

Fig Bar cells with one, two and three elements
BarArc

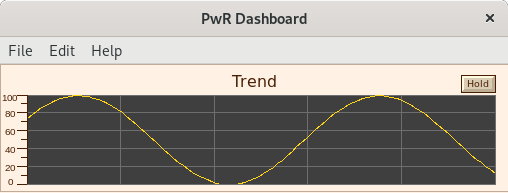
Trend
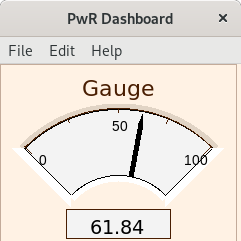
Gauge
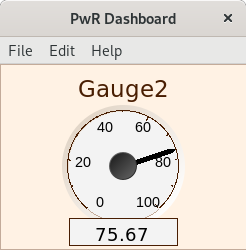
Gauge2
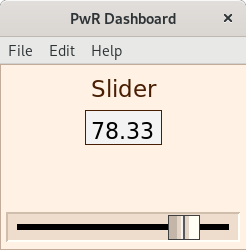
Slider
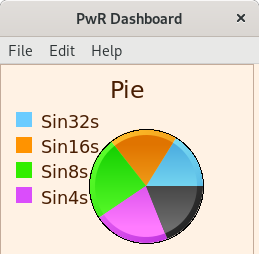
Pie
Digital dashboard cells
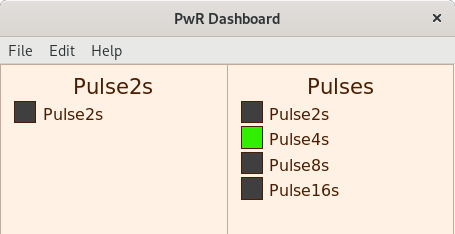
Indicator
DigitalTrend

Object dash cells
Object cells exist for some object, eg DsTrendCurve.
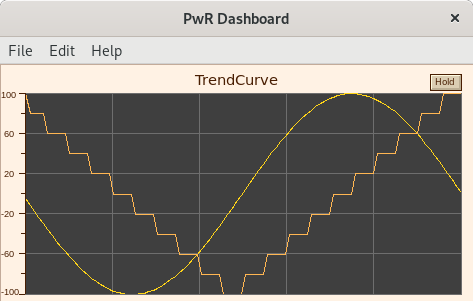
Fig Object cell for DsTrendCurve
Create a dashboard in rt_xtt
By selecting and attribute in the navigator, and activating Functions/Dashboard/Insert
(Ctrl+D) in the menu, the attribute is added to a dashboard. By default it's added to the
'PwR Dashboard', but if there is a dashboard that is in edit mode, it will be inserted in
this dashboard instead. It's possible to add new attributes to the dashboard until all rows
and columns are filled.
For an analog attribute a bar cell is created. This can be changed by entering edit mode in
the dashboard from File/Edit (Ctrl+E) in the dashboard menu. Open the cell attributes
(double click) and select another type in Dash.Type. Leave the edit mode with Ctrl+E.
When entering edit mode, the Ge editor is opened in restricted mode. Some functionality in
edit mode is
- Add. Create an empty cell.
- Delete. Delete cell.
- Copy. Copy a cell.
- Paste. Paste previously copied cells.
- Connect. Connect selected attribute in the navigator to cell.
- Merge. Merge cells. The selected cells will be merged into the one that was first selected.
- From GraphAttributes, the scan time and dashboard size can be modified.