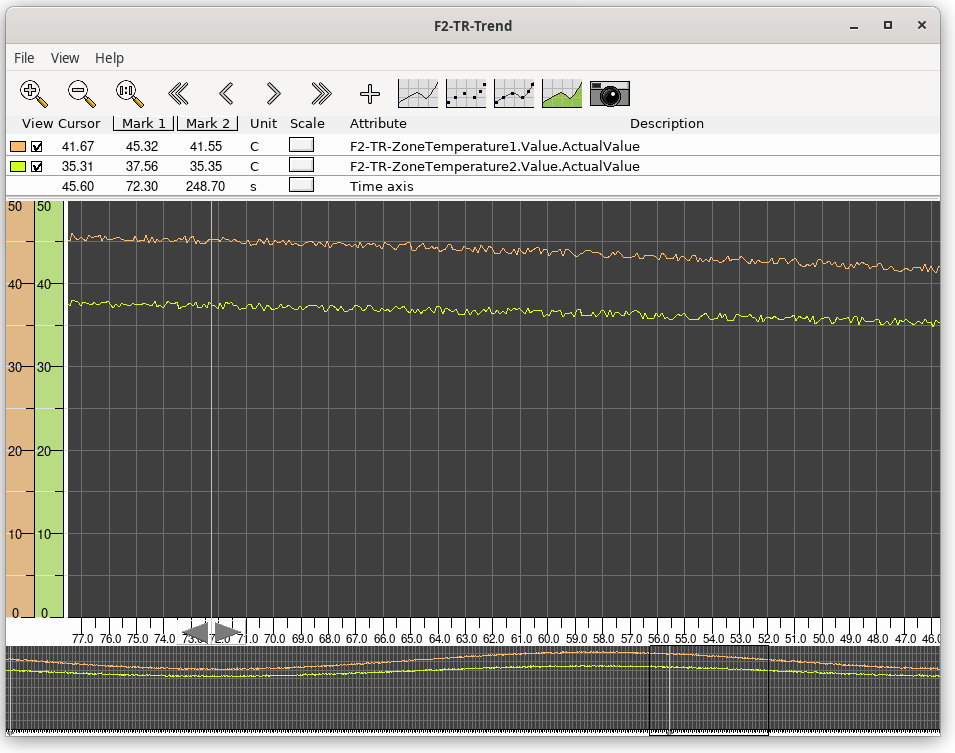
Trends


Trendcurves are opened from the 'Trend' method in for example the popup menu. They can
also be opened by the Xtt command 'open trend'. Trend curves are configured by DsTrend
objects and, if several curves are viewed in the same curve window, by PlotGroup objects.

A trendcurve is a signal value, for example of type temperature, pressure or flow, that
is stored with a specific time interval. A trendcurve can store 478 values, and so the
total time window depends on the time resolution. If a new value is stored every second,
a total of 8 minutes can be stored, and with a new value every minute, eight hours can be
stored. The values are stored in the RAM memory, and will be lost at a reboot.

The trendcurves are viewed in a curve window. A curve window can display 20 different
curves.


Fig Trendcurves

The upper part of the curve window views a table over the curves. The first column is
a color indication to identify the corresponding curve.

Description of columns in the table

View                A checkbox from which you can choose to view or hide the curve.
Cursor              Shows the curve value where the cursor is placed.
Mark1               Shows the curve value where the first marker is placed.
Mark2               Shows the curve value where the second marker is placed.
Unit                Displays the unit of the curve.
Scale               From 'Scale' you can change the scale in y direction (Scale on
              the Time axis row changes in x direction).
Attribute           States the attribute of the trend curve.
Description         Description of the attribute.

Navigation

The tool panel contains buttons to zoom and move the view to the left or to the right.

You can also navigate with the navigation window in the lower part of the window. The part
of the curve that is displayed, is marked with a black square. With drag MB1 you kan move
the view in x direction, and by dragging the middle button you can zoom in and out.

Navigation from the keyboard is accomplished with the arrow keys. With arrow up and down
the zoom factor is changed, and arrow left and right moves the view to the left and to the
right.

Markers

There are two markers in the window that can be positioned at specific time values. The
curve value for the position is displayed in the table. The markers can be moved with
the cursor, or by clicking with MB1 (first marker) or with Ctrl+MB1 (second marker) in
the curve window.

Snapshot

For some trends it is possible to take snapshot of the current trend, in order to examine
it more carefully or save it to file. The snapshot is activated with the camera button in
the trend toolbar, and a new curve window is opened with the snapshot.
See Trend snapshot

Add curves

Curves can be added to the current trend window by selecting a DsTrendCurve object in the
runtime navigator and activating the '+' button in the toolbar.

Graph grid

When several curves are present, the graph grid is adapted to the scale of a specific
curve by clicking on the colored scale for this curve.

Export to text file

A trend can be exported to text file from File/Export in the menu. In the export dialog,
a specific attribute can be selected for export, or all attributes. To avoid overwriting
previous exported files, the filename can contain the string '$date' which will be replaces
by the current date in the actual file name.