Display analog values
Display analog value as figures
To display analog values as figures you use the dynamic Value. Value is connected to an
analog signal and the value is converted to suitable format by the format specification.
The value dynamic can be used on subgraphs that contains an annotation, ie a place where
a text can be printed. One example of such a subgraph is ValueLargeCenter.

Fig ValueLargeCenter
We create a ValueLargeCenter and connect it to the analog signal H4-Av1. We also have to
specify the format in Value.Format. '%f' is the format for a float, and you can also specify
the number of characters and decimals in the figure. The format '%7.2f' states that the format
is 7 characters with the decimal point, and two of these are decimals.
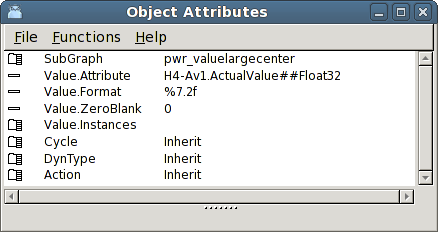
Fig Value dynamic with format specifier
The result is shown in the figure below, The analog value is written with two decimals.
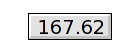
Fig Value dynamic
Note that the Value dynamic also can be used to show the content of other types of signals,
eg integer, string, time etc.
By creating several instances of Value dynamic for one object, it is possible to show
serveral analog value is the same object. This requires that the subgraph contain several
annotations.
Analog values can also be displayed in the shape of curves and bars. This is described in the
chapter 'Special objects'.
Trend
Bar